SPECIAL PROMOTION
![]()
About Us
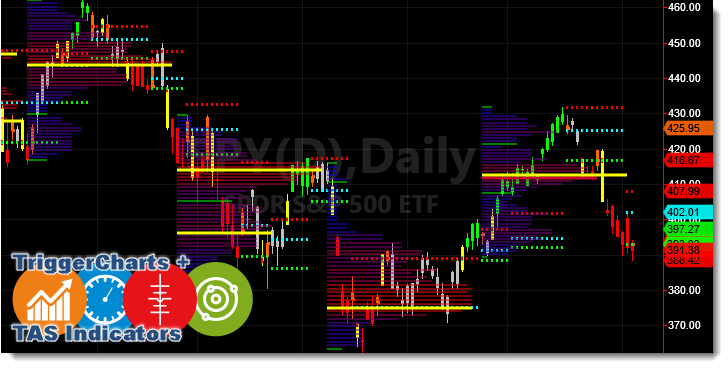
TriggerCharts combined with TAS Indicators are a structured and logical approach to analyzing and interpreting the markets that has its foundation in the principles of Auction Market Theory and Market Profile®, developed by legendary floor trader, Peter Steidlmayer.
Although Auction Market Theory and Market Profile® tend to be very complex in their typical presentation—and take years to understand and master—TriggerCharts has distilled and simplified these fundamentals into precision trading tools that reveal what you need to know about the actions of markets.
TriggerCharts + TAS Indicators
TAS Vega
TAS Vega provides indisputable clarity to know exactly when the market is bullish (green), bearish (red), or in the balance zone (grey) making it crystal clear what side of the market is in control.
TAS Boxes
TAS Boxes displays a real-time representation of developing balance and imbalance areas by measuring volume-at-price, a statistical method for aggregating trading data.
TAS Market Map
TAS Market Map delivers the industry’s most visually-appealing Market Profile with crisp, color-coded horizontal histograms revealing volume accumulation, gaps, and critical value areas.
TAS Navigator
TAS Navigator is a versatile combination indicator that identifies when momentum is changing and trend exhaustion is likely. Traders can objectively gauge the strength of a move and prepare for market turns in advance.
TAS Ratio
TAS Ratio forecasts short-term price movements and is especially useful for gauging intraday target exits. It was designed to identify when price movement is confirmed by volume and volatility.
TAS PCLs Statics & Floaters
TAS Price Compression Levels (PCLs)provide two distinct array of reliable support and resistance levels displayed on your chart.


