In a market that is trending, it is an easier task to simply hop on and take a ride. However, when volatility picks up, where can you find levels that may provide confidence to stay long or get out? This is a serious question that many investors have on their minds when the selling picks up.
Fortunately, we have some answers.
The most important thing to know when looking at a chart, is where the buyers and sellers are congregating. As mentioned in last month’s newsletter, that can be identified through a market profile. Moreover, we have taken the idea of market profile one step further and created a system that clearly identifies key levels of support and resistance – based on where buyers and sellers are most active.
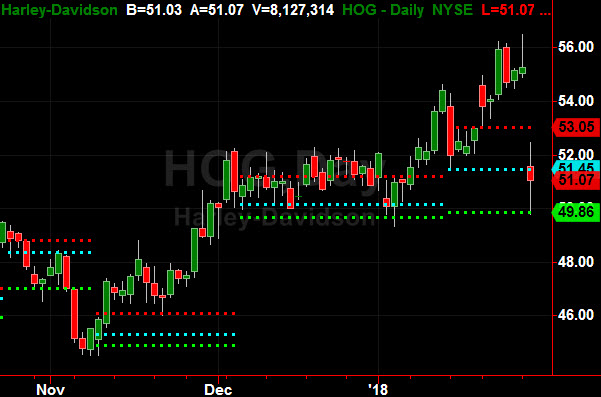
All it takes is the understanding of three lines on a chart. The top signifies the upper range of the profile, the middle the heaviest volume-at-price. The lower level is where buyers and sellers have supported. In other words, these three horizontal lines that appear on the chart are the levels that signify entry and exit signals.
Essentially, the lines reveal where traders are putting money to work (or taking some off the table).
The charts below illustrate how the lower bounds (aka unfair low) can be used to find levels of support in order to keep you in the trade or help identify when it is time to get out. There is no magic in this – rather it is the culmination of price and volume that allows you to have insights into market philosophy.
If you find that you have been shaken out of positions at the wrong time, the Altimeter is a great tool to help you clearly see that all important line in the sand.
$42.79 is support for SHAK (daily chart).
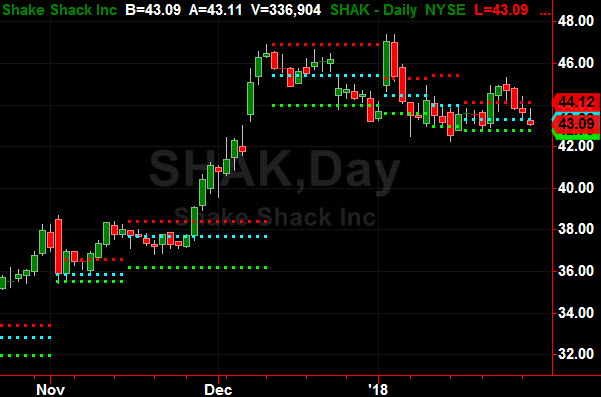
The chart below illustrates the “look back” concept for finding support points in the past.
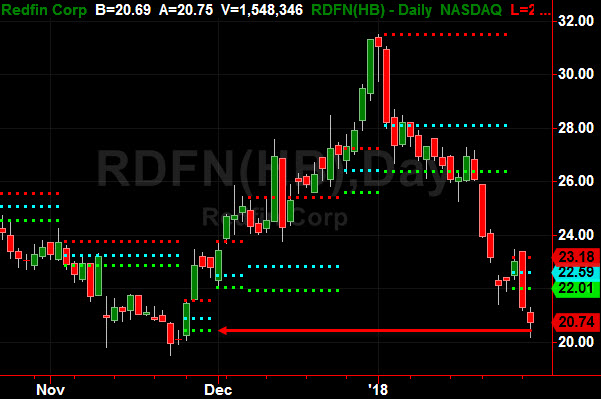
Hitting support and holding.
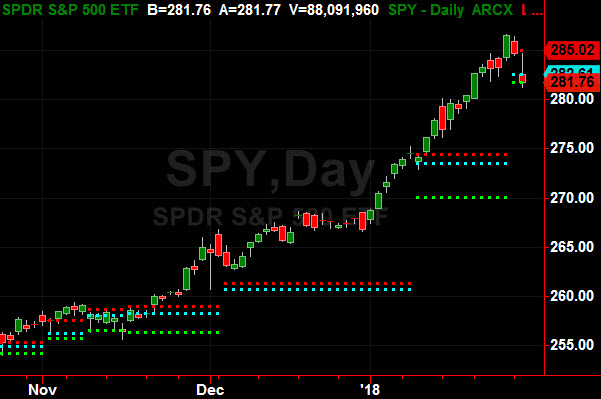
Bouncing on support.
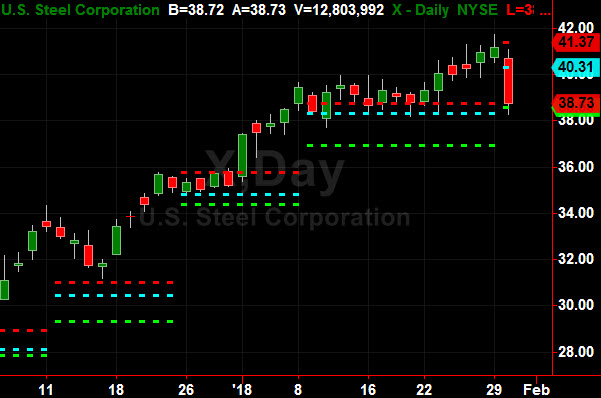
Drops and then holds.
The best part – there is a 10-day free trial available.

